Building a financial data platform that covers US-listed companies sounds straightforward — until you encounter Foreign Private Issuers (FPIs). Companies like Alibaba, Bilibili, Sea Limited, and Baidu don't file 10-Qs like domestic companies. They file 6-Ks, and the data extraction story is entirely different.
This post walks through the real technical challenges we hit while building 10q10k.net, and the solutions we landed on.
The Two-Track Filing System
US-listed companies fall into two categories:
- Domestic filers submit 10-Q (quarterly) and 10-K (annual) reports with structured XBRL data. The SEC's
companyfactsAPI gives you clean JSON with every financial concept tagged and machine-readable. - Foreign Private Issuers submit 20-F (annual) and 6-K (current reports). Their quarterly data lives inside HTML exhibits attached to 6-K filings — essentially press release PDFs rendered as HTML tables.
The XBRL path is trivial. Hit https://data.sec.gov/api/xbrl/companyfacts/CIK{cik}.json, extract RevenueFromContractWithCustomerExcludingAssessedTax from the us-gaap namespace, filter by period duration, done.
The 6-K path is where things get interesting.
Challenge 1: Finding the Needle in the 6-K Haystack
A single FPI might file 50-200 6-K reports per year. Most aren't earnings releases — they're governance notices, share purchase agreements, proxy statements, and regulatory disclosures. Only 4-8 per year contain quarterly financial statements.
The Naive Approach (Too Slow)
Our first implementation downloaded every 6-K exhibit and ran a regex check:
const INCOME_HEADER_RE = /(?:CONDENSED\s+)?(?:CONSOLIDATED\s+)?STATEMENTS?\s+OF\s+(?:OPERATIONS|INCOME)/i;

function is6kEarningsRelease(html: string): boolean {
  return INCOME_HEADER_RE.test(html);
}
For a company with 195 6-K filings, this meant 195 HTTP requests just to find 8 earnings releases. At SEC's 10 req/s rate limit, that's 20+ seconds of I/O before we even start parsing.
The Solution: Pre-filter by Filing Size
SEC's submissions JSON includes a size field for each filing — the total filing size in bytes. Earnings press releases with their large HTML financial tables are consistently 300KB-700KB, while governance 6-Ks are typically under 100KB.
function find6kEarningsCandidates(submissions: any): Filing6kCandidate[] {
  const filings = submissions?.filings?.recent;
  const sizes = filings.size || [];
  const candidates: Filing6kCandidate[] = [];

  for (let i = 0; i < filings.form.length; i++) {
    if (filings.form[i] !== "6-K") continue;
    const totalSize = parseInt(String(sizes[i] || 0), 10);
    if (totalSize > 0 && totalSize < 300000) continue; // Skip small filings
    candidates.push({ /* ... */ });
  }
  return candidates;
}
This single filter reduced our candidate set from 195 to ~30 filings, cutting the discovery phase from 20 seconds to under 5.
Two-Phase Exhibit Discovery
Even after the size filter, we don't want to download 30 full HTML documents (each 200KB+). Instead, we use a two-phase approach:
Phase 1: Fetch each filing's index.json (~300 bytes) to check if it contains an ex99*.htm exhibit above 25KB. This is cheap — 30 small JSON requests batched 6-at-a-time.
Phase 2: Only download and parse the ~8 filings that actually have large exhibits.
Challenge 2: The Currency Column Problem
This is where the real pain begins. FPI earnings tables are designed for human readers, not machines. A typical Chinese FPI income statement looks like this:
                          Three Months Ended March 31,
                            2024        2025        2025
                            RMB         RMB         US$
Net revenues:
  Value-added services    2,528,909   2,807,340    386,862
  Advertising             1,668,584   1,997,635    275,281
  Mobile games              982,810   1,731,155    238,560
Total net revenues        5,664,600   7,003,248    965,073
The challenge: which column has the USD values?
The third column (US$) is a "convenience translation" — the same numbers converted at a stated exchange rate. Columns 1 and 2 are in RMB. If you grab the wrong column, your revenue is off by 7x.
Detecting the USD Column
We scan the first 8 rows of each table for a currency header row — a row where most tokens match known currency codes:
const USD_RE = /^\$?US\$?$|^USD$|^\$$/i;
const CURRENCY_RE = /^(?:\$|RMB|US\$?|USD|CNY|VND|JPY|EUR|GBP|...)$/i;

for (const row of rows.slice(0, 8)) {
  const tokens = row.rawText.split(/\s+/).filter(s => s.length > 0);
  const currencyCount = tokens.filter(t => CURRENCY_RE.test(t)).length;
  if (currencyCount < 2) continue;

  let colIdx = 0;
  for (const t of tokens) {
    if (!CURRENCY_RE.test(t)) continue;
    if (USD_RE.test(t)) { usdIndex = colIdx; break; }
    colIdx++;
  }
  break;
}
Fun edge case: Sea Limited (a Singapore company) uses bare $ instead of US$ in their tables. Our initial regex didn't match that, so their entire filing returned null.
When There's No USD Column At All
Here's the twist: most Chinese FPI filings before 2025 don't include a USD column. The entire table is in RMB.
But they do include a conversion note in the filing text:
All translations from RMB to US$ were made at the rate of RMB 7.2993 to US$1.00, the exchange rate on December 31, 2024.
So we extract the exchange rate with a simple regex and convert:
function extractExchangeRate(html: string): number | null {
  const plain = html.replace(/<[^>]+>/g, " ");
  const match = plain.match(/RMB\s*([\d.]+)\s*to\s*US/i);
  if (match) {
    const rate = parseFloat(match[1]);
    if (rate > 1 && rate < 100) return rate;
  }
  return null;
}
When no USD column exists, we use the most recent quarterly column (in local currency) and divide every value by the exchange rate. The rate > 1 && rate < 100 guard prevents garbage matches.
Challenge 3: Scale Detection Gone Wrong
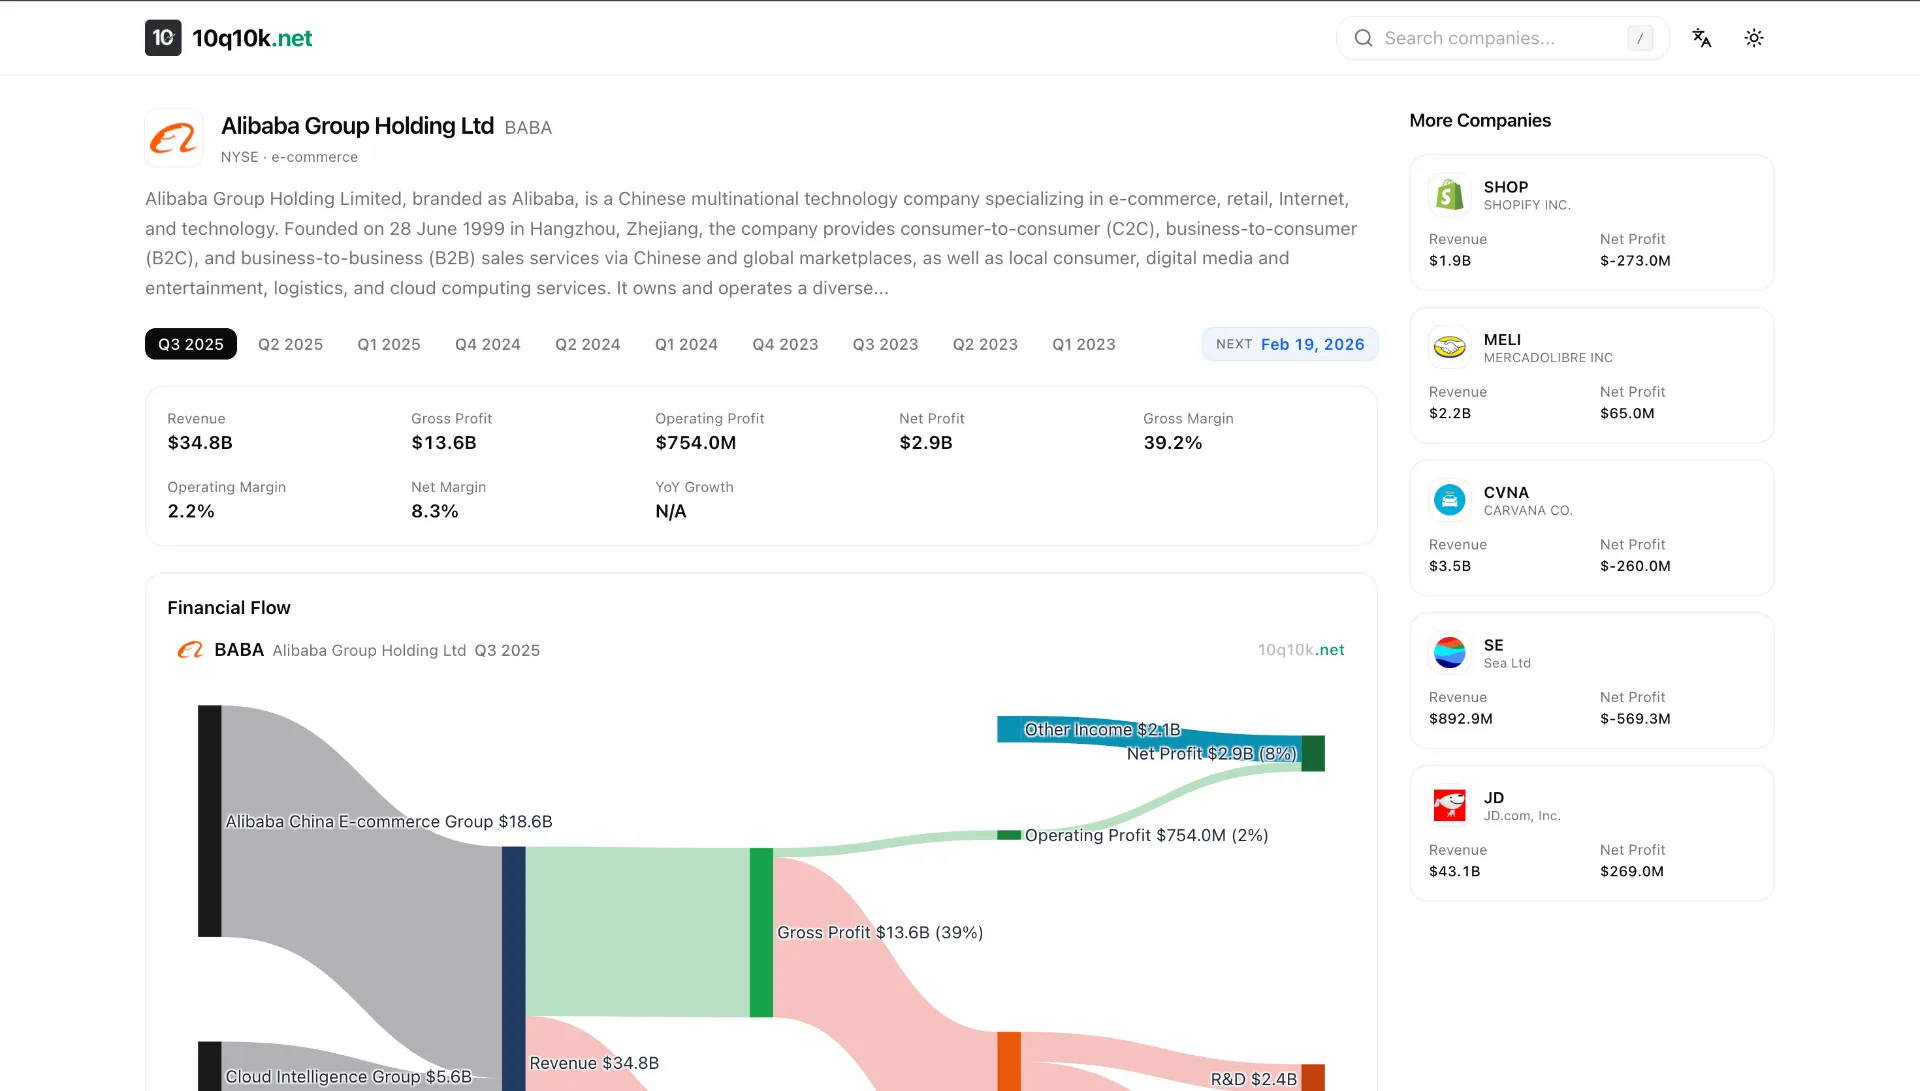
This one caused our most spectacular data errors — $458 billion quarterly revenue for Alibaba (actual: ~$34 billion).
Financial tables express values in different scales:
- "In millions" → multiply raw values by 1,000,000
- "In thousands" → multiply by 1,000
- No indicator → values are in base units
The scale indicator can appear in many places:
- Table header row:
(In millions, except per share data) - Between the section header and the table (what we call the "preamble")
- In a footnote 2,000 characters before the table
- Nowhere near the table at all, but somewhere in the document
The Cascading Scale Detection
We settled on a three-level cascade:
1. Check preamble text (between "Statements of Operations" header and <table>)
2. Check nearby HTML (2000 chars before the table)
3. Global document scan (last resort)
The critical lesson: never guess the scale from the magnitude of the values. We originally had a heuristic (autoDetectScale) that tried to infer scale from the raw numbers — "if revenue is 34,820, it's probably in millions; if it's 34,820,000, it's probably in thousands." This failed catastrophically for FPIs where revenue numbers in local currency (RMB) can be 10x larger than expected USD ranges.
Challenge 4: Table Structure Variance
Not all income statements follow the same HTML structure. We encountered three patterns:
Pattern A: Section header → Table (most common)
<b>Condensed Consolidated Statements of Operations</b>
<table>...</table>
Pattern B: Standalone quarterly table (Sea Limited)
The quarterly income statement appears as a standalone table with "For the Three Months Ended" in its own header row, not under any "Statements of Operations" section header.
Pattern C: Mixed content (Bilibili)
The first regex match for "Statements of Operations" lands on a text paragraph that happens to contain those words, and the next <table> is actually a balance sheet.
Our solution: a layered search strategy.
1. findSectionTables() — match header regex, grab next <table>
2. If no quarterly data found, scan ALL tables for "Three Months" rows
3. If still nothing, accept non-quarterly data from section tables
Challenge 5: SEC Rate Limiting at Scale
SEC EDGAR enforces a 10 requests/second rate limit. Our initial implementation was getting 429'd constantly because:
- Batch of 8 parallel
index.jsonrequests + 200ms pause = ~40 req/s - Following a 301 redirect (from padded CIK URLs) doubles the request count
Fixes:
- Strip leading zeros from CIK in URLs (avoids 301 redirect)
- Reduce parallel batch to 6 with 600ms delay
- Add exponential backoff retry on 429:
for (let attempt = 0; attempt < 3; attempt++) {
  const res = await fetch(url, { headers });
  if (res.status === 429) {
    await sleep(2000 * (attempt + 1));
    continue;
  }
  // ...
}
The hasQuarterlyXbrl Trap
One subtle bug: our system checks whether a company has quarterly XBRL data (meaning we can use the structured API instead of parsing 6-K HTML). Baidu had exactly one quarterly XBRL entry — from 2018. This caused our code to skip the 6-K path entirely, producing zero revenue data for 2023-2025.
The fix was embarrassingly simple: only consider XBRL entries from the last 3 years.
Revenue Segments: Vertical vs. Horizontal
Different companies structure their revenue breakdown differently:
Vertical (Bilibili):
Net revenues:
  Value-added services    386,862
  Advertising             275,281
  Mobile games            238,560
Total net revenues        965,073
Horizontal (Sea Limited):
              E-commerce  DigitalFinancial  Entertainment  Total
Revenue       4,294,756   989,861           653,033        5,986,024
Our segment parser handles the vertical case by looking for rows between a "revenues:" header and a "total revenues" footer. The header might or might not have a trailing colon. The header row might or might not have numeric values (distinguishing it from a data row that happens to contain "Revenue").
The horizontal case requires different logic entirely — treating column headers as segment names and extracting the value from each column of the revenue row.
Architecture: Cloudflare Workers + D1
The whole system runs on Cloudflare Workers with D1 (SQLite) as the database. A cron trigger fires every 2 minutes, processing 30 companies per invocation. For FPIs, the 6-K parsing can take 30-60 seconds per company due to SEC rate limits, which is borderline for Worker execution limits.
Key lesson: long-running HTTP-triggered tasks (ctx.waitUntil) can timeout silently. We moved FPI processing to the cron handler which has more generous time limits, and added auto-recovery for jobs stuck in "running" state.
Takeaways
- Pre-filter aggressively. Filing size metadata can eliminate 80% of candidates before any exhibit download.
- Never infer numeric scale from value magnitude. Always look for explicit indicators in the document text.
- Currency detection is not optional. FPI tables mix local currency and USD columns — grabbing the wrong one gives you 7x errors.
- Build for variance. Every FPI structures their earnings release slightly differently. Your parser needs multiple fallback strategies.
- Respect rate limits from the start. Retrofitting rate limiting into a batch pipeline is painful. Build it in from day one.
The structured XBRL world is clean and predictable. The FPI 6-K world is messy, inconsistent, and full of edge cases. But it's also where you find some of the most interesting companies in the market — and getting their data right is worth the effort.
10q10k.net is an open financial data platform with interactive Sankey diagrams for 6,000+ US-listed companies. The FPI parsing pipeline described here handles companies from China, Singapore, Brazil, and 20+ other countries.